
FileMaker is a powerful tool for data visualization, with many tools to display the story that the numbers tell. What many may not realize is that the vector-based SVG button icons can be utilized for some very flexible custom charting. Let's explore how we can use them to quickly construct a choropleth map, more commonly called a heat map.
Watch on YouTube Heat Maps in FileMaker
Creating a Heat Map
FileMaker not only has the ability to import SVG icons, but it also gives the ability to change their color with conditional formatting. This is key to using them for data visualization. All we need to get a heat map up and running are our SVG icons and some conditional formatting rules. For my map, I am using individual American states created in Adobe Illustrator. Once you have whichever SVGs you wish to use positioned on your layout, add conditional formatting based on data fields. 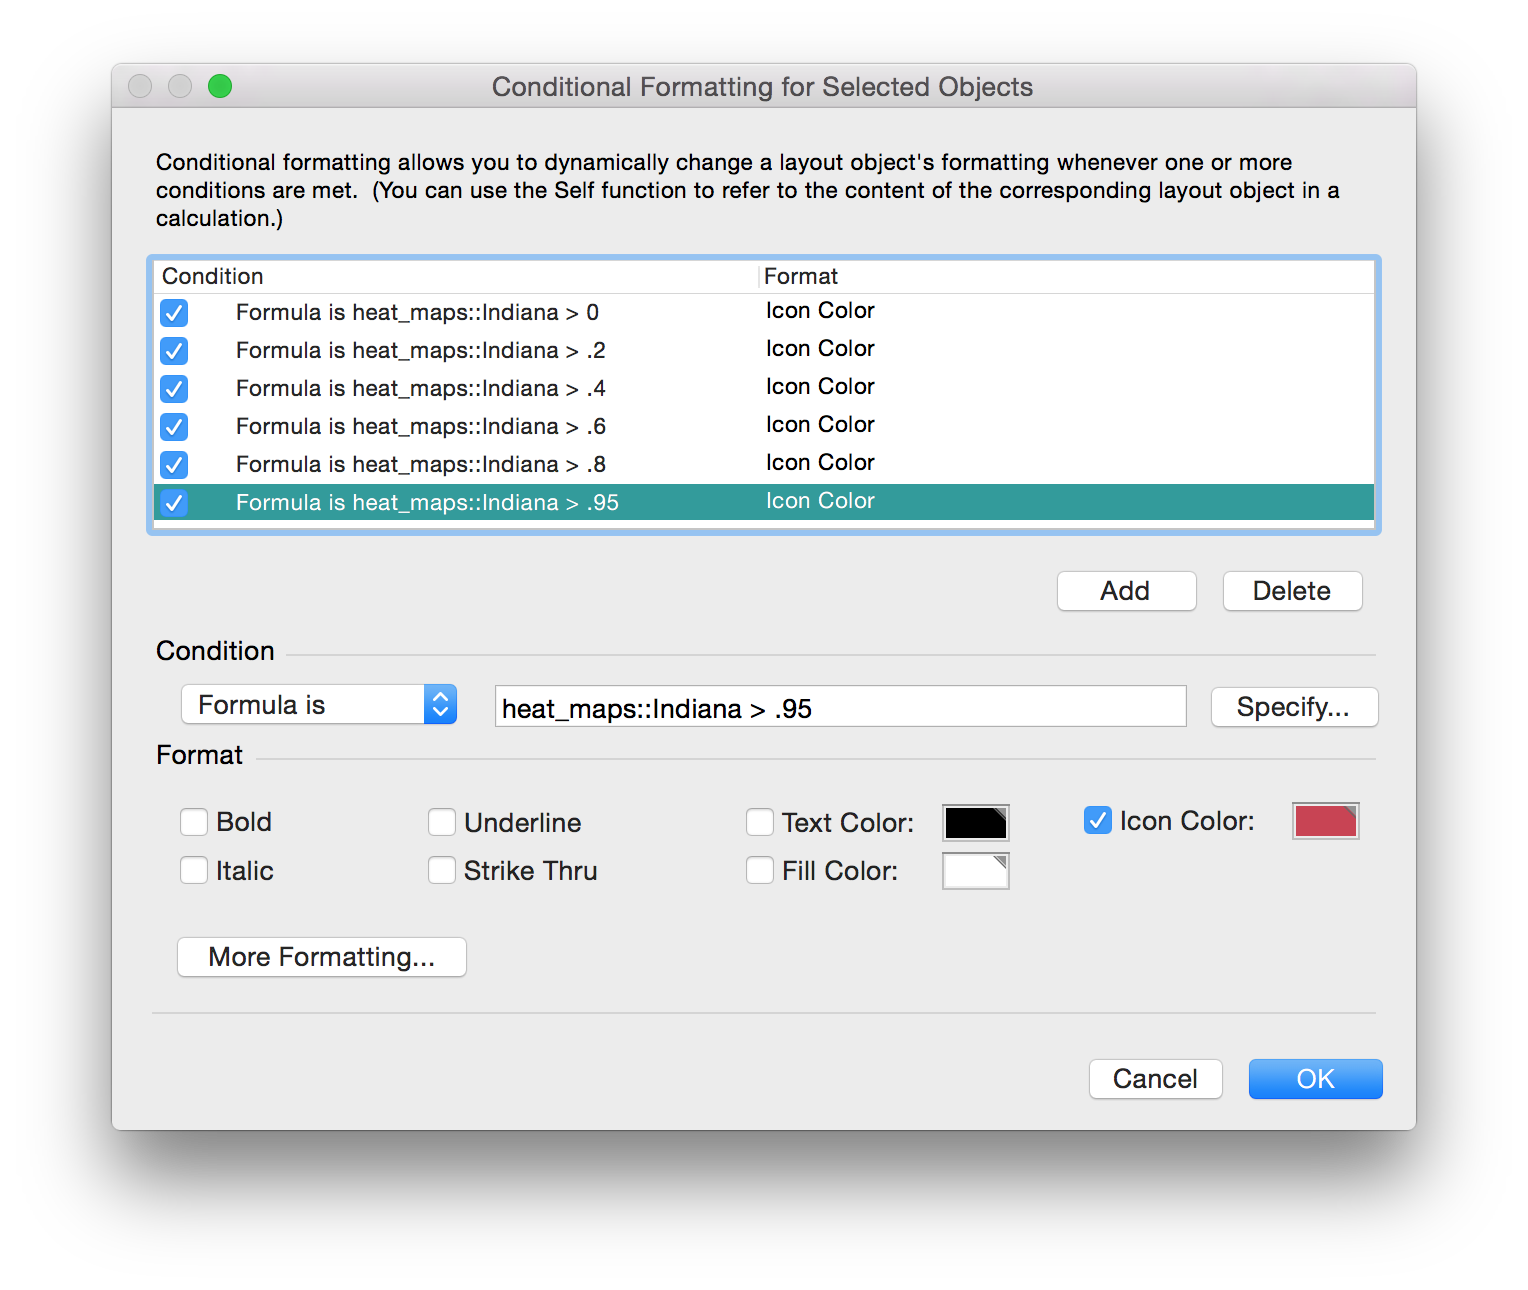 Within the conditional formatting, define different icon colors for the breakpoints of data. Pay close attention to the order of the conditional formatting, since FileMaker will evaluate all the rules from top to bottom.
Save your layout, and that's it! You now have a heat map in FileMaker.
TIP: Use seven colors or less, otherwise you risk making the map difficult to read.
Limitations
An SVG heat map is fully compatible with iOS and Web Direct, however, there are some limitations.
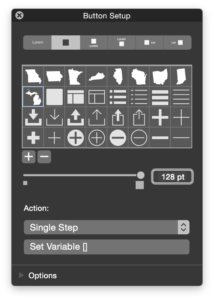
First, there is a size limitation. The button setup as of FileMaker 14 limits icon size to a maximum of 128 points. This means that large objects like Texas will limit the size that other states can be displayed. A workaround for this is cutting the largest objects into quarters or smaller elements and then aligning the object parts.
Another limitation is that conditional formatting on a button overrides the hover state. This means that if we wish to turn our icons into buttons, there will be no hover color. The workaround to this is duplicating the heat map and creating a transparent map of clickable buttons, without any formatting. This method has two downsides: first, the layered objects in layout mode will make it difficult to modify the conditional formatting located on the back layer; second, if any objects have been segmented because they were too large, the hover state will only apply to a single section. If this is an issue, you can simply elect to not have a hover state.
The last thing to keep in mind is that the button boundaries will not be the same shape as the icon--by default they will be square. You can work around this by rounding the corner radius on one or all of the icon corners to minimize overlap.
Custom Charting Beyond Heat Maps
SVGs are a very flexible medium and can be used for more than just a heat map. With this same technique, you can make pretty much any custom chart you can imagine. One could highlight parts of a car or other object, display health data on a human body, or illustrate an organizational chart. The sky is the limit!
If you use this method for a custom graph of your own, tweet it to us and share your awesome ideas.
Did you know we are an authorized reseller for Claris FileMaker Licensing?
Contact us to discuss upgrading your Claris FileMaker software.
Download the FileMaker Heat Maps File
Please complete the form below to download your FREE FileMaker file.