

FileMaker is very adept at creating list reports, but often you want to see your data in a grid format. This is when crosstab reports, also referred to as pivot tables or matrix reports, come in handy. A crosstab report is a way to display data from 2 or more different sources in a grid format. Luckily there are still plenty of options for doing this in FileMaker. Some methods are better for data entry, some are better for viewing, and some are better for speed and flexibility.
Why use a Crosstab Report?
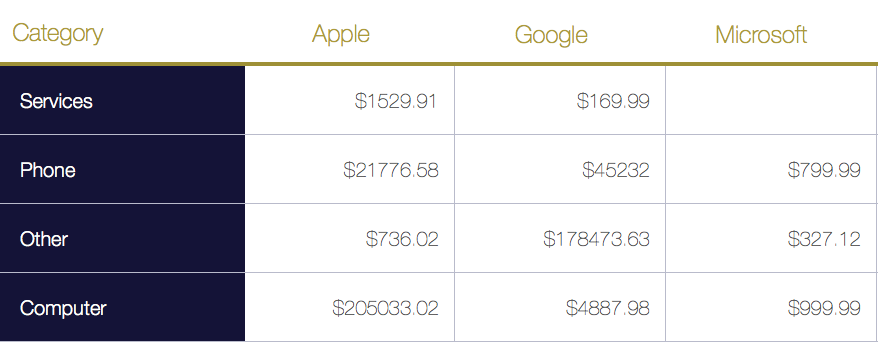
Crosstab reports format groups of data into an easy to read grid format. If this sounds like an excel spreadsheet, that's because it is. There is a reason people love their spreadsheets, it makes comparing values in one group with values in another group really easy. Below you can see an example of 2 reports showing the exact same data, but the crosstab report makes comparing company yearly sales much easier. This is why crosstab reports are so powerful.
Native FileMaker
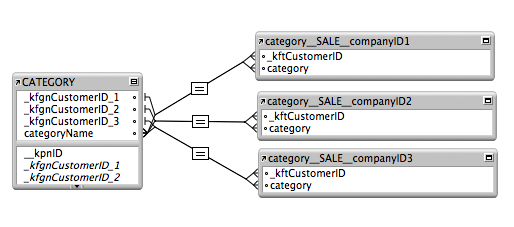
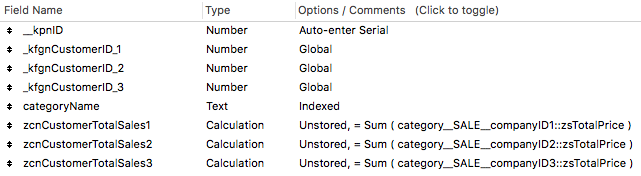
The example below is built all with native FileMaker and involved creating 3 globals, 3 relationships, and 3 calculations and is limited to only showing 3 companies at a time. That's a lot of work just to show 3 columns, and not very realistic as chances are you're going to have a lot more than 3 companies in your system. However, data entry and printing are going to be easier using this technique, and you have the advantage of not having to learn any other technologies.
Web Viewer
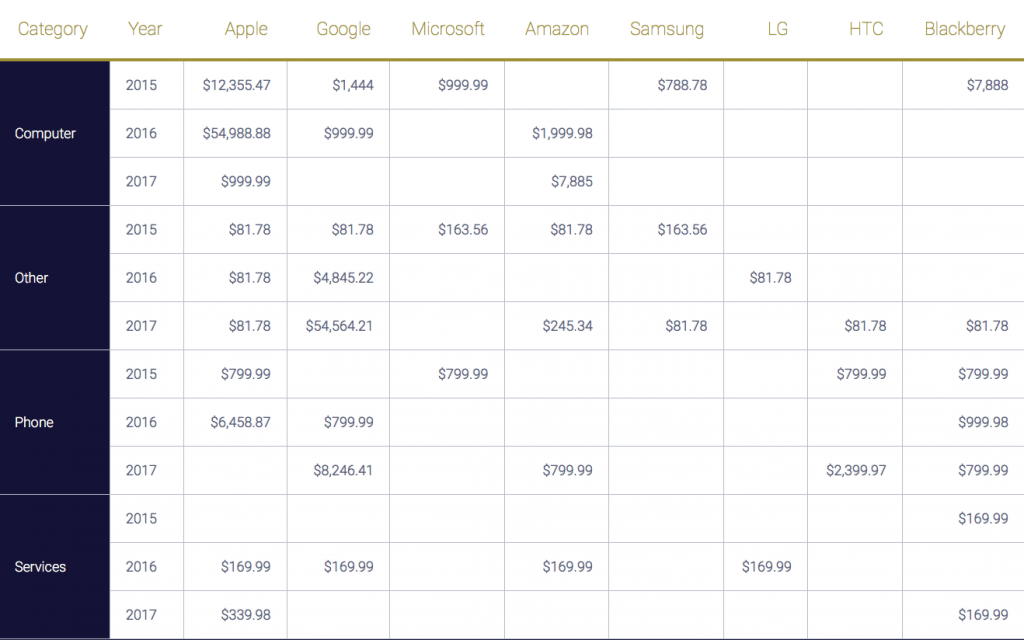
In this example, I'm going to build a crosstab report using HTML and CSS and display the results in a web viewer. While this version will not have any data entry involved, that is also possible using javascript to pass the data to FileMaker using either the new REST API or using FMP URLs. As you can see below we are showing 8 companies, as well as grouping the data by year and I didn't have to make 8 of everything! All it took was 2 globals and 2 relationships, one for the year and one for the category. The best part is that I can add new categories, companies, or dates outside of 2015-2017 and it will all adjust automatically and reformat to fit the data.
How it's done
In order to build a report like this, you have to be somewhat familiar with HTML and CSS, but it's really not too hard to learn. If you're new to HTML I'd suggest starting with a tool like rapidtables to quickly generate the HTML required to make the table, and all the CSS. Below is an example of the output from RapidTables as well as some HTML markup to display the data properly in a web viewer. Feel free to copy and paste the code below into a web viewer to see the table; just make sure to escape any double quotes with either a slash before it or change them to single quotes.
data: text/html,
<html>
<head>
   <title>Demo</title>
</head>
<body>
<!--START OUTPUT FROM RAPID TABLES-->
<style>
.demo {
   border:1px solid #C0C0C0;
   border-collapse:collapse;
   padding:5px;
}
.demo th {
   border:1px solid #C0C0C0;
   padding:5px;
   background:#F0F0F0;
}
.demo td {
   border:1px solid #C0C0C0;
   padding:5px;
}
</style>
<table class="demo">
   <caption>Table 1</caption>
   <thead>
       <tr>
          <th>Header 1</th>
          <th>Header 2</th>
          <th>Header 3</th>
       </tr>
   </thead>
   <tbody>
      <tr>
          <td> </td>
          <td> </td>
          <td> </td>
      </tr>
      <tr>
          <td> </td>
          <td> </td>
          <td> </td>
      </tr>
   </tbody>
</table>
<!--END OUTPUT FROM RAPID TABLES-->
</body>
</html>
Adding Your Data
Now all you have to do is use your FileMaker skills to generate a string that resembles the data above, but replacing the headers and (Which stands for non-breaking space) with your data. You could do this by either using calculations or as I did in the demo file, a script to loop through the records generating all the text in a variable.
Printing
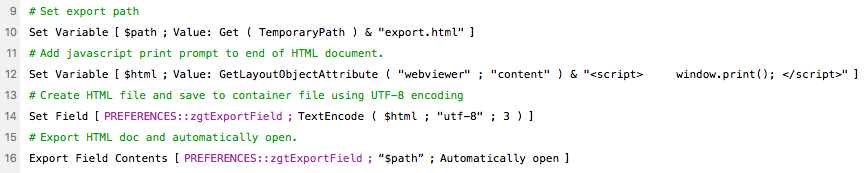
Printing a web viewer can be a bit of a challenge if you've never tried. One way to tackle this is to export the web viewer contents to the temp directory with a little extra Javascript, which when opened will open the print dialog on the user's default browser. You can even add CSS specifically for printing which allows for more flexible printing.
Report Speed
Using native FileMaker methods to compile lots of data can not only be slow to build but can be slow to display, especially if running the report over the WAN. Using a webviewer to generate a crosstab report has the huge benefit of being able to process and crunch all the numbers on the server because all we are doing is working with text, you can very easily script the report to run on the server and return the data in the script results. This makes running reports lighting fast.
Conclusion
Building crosstab reports can be a bit of a challenge and there are many ways to tackle the problem. Different situations might require different techniques, which is why knowing multiple ways to create crosstab reports is so useful. When it comes to speed and flexibility it's hard to beat using a web viewer, and can be great at speeding up slow reports. If you need further assistance creating crosstab reports in FileMaker, please contact us today.
Did you know we are an authorized reseller for Claris FileMaker Licensing?
Contact us to discuss upgrading your Claris FileMaker software.
Download the FileMaker Crosstab Reports File
Please complete the form below to download your FREE FileMaker file.