
 Though FileMaker crashes are rare, when they do happen, it can be a pain for developers and users alike. They can cause many headaches such as corrupted databases, loss of data, loss of recent development changes, etc. For developers, it can be especially difficult because it is hard to debug and find the cause of the crash as the FileMaker application stops responding after a crash. For those of us using the FileMaker platform to create FileMaker databases, there is not much we can do to fix the cause of the problem. However, we can find what is causing the issue and attempt to work around it. In this article, we will show you how to take advantage of the Mac crash report and the Windows DebugDiag tool to efficiently identify workarounds when FileMaker crashes.
Mac Crash Reports
When a crash happens, you are presented with the option to view the report. The report contains information about the user’s environment and the stack trace at the time of the crash. For a detailed explanation of each part of the report, go to the Apple crash report technical note. For FileMaker developers, the important sections to look into are the process information, basic information, exception information, and the backtrace information, with the backtrace information being the most useful.
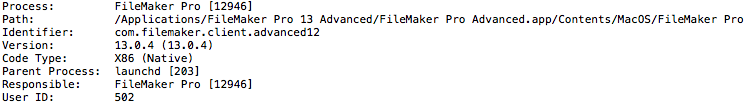
The process information and basic information sections are the first two sections of the report. The process information section is where you can find what version of FileMaker the user is currently using.
The basic information section gives you the Mac OS version the user is on at the time of the crash. You will want to make sure that the user is on a compatible version of the Mac OS. This will only be a concern for FileMaker 12 and prior as FileMaker 13 does not allow users to install on an unsupported OS.

The exception information section of the report gives you the crashed thread number. You will want to look at the backtrace of the thread with this thread number.

Backtrace Section
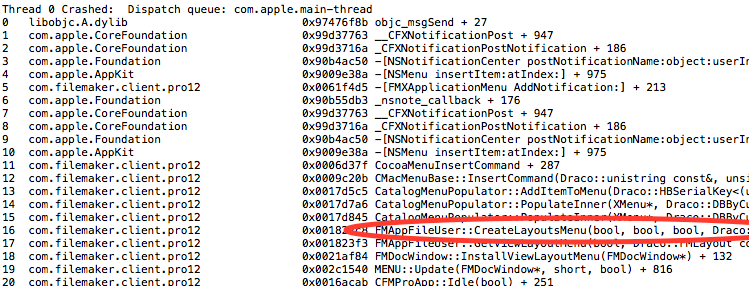
The backtrace section is the most important section of the report. It gives you the list of functions called within a thread with the most recently called at the top starting at 0, and the oldest at the bottom. You will want to look at the 2nd and 4th columns of the backtrace. The 2nd column gives you the application that calls the function. The 4th column is the function being called. You will want to look at any com.filemaker lines starting from the top and work your way down to see what functions are being called. You will want to focus on the functions that make sense to you as a developer. This will give you a list of possible things to try to avoid using in your FileMaker database. In the example provided below, the user reported that their FileMaker would crash but they did not know why. When the user sent the crash report, we were able to see that the FileMaker function calls consistently referenced LayoutMenu. We then made sure that all layouts were not visible in the layout menus. This stopped FileMaker from crashing.
Windows Crash Reports
When FileMaker crashes on a Windows machine, the user is not automatically presented with the option of viewing the stack trace at the time the program crashed. In order to view the crash report in Windows, you will first need to download and install the DebugDiag tool from the Microsoft website.
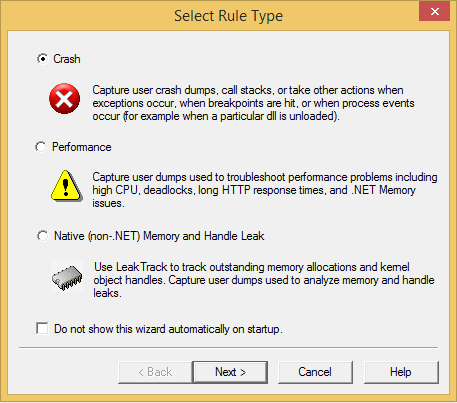
Open the DebugDiag Collection program and add a rule, which will be used to create a crash dump file once FileMaker crashes. To create the rule, you will need to set the rule type as a Crash and the target type as a specific process. You will then select FileMaker out of the list of process names. Please note that FileMaker needs to be running in order to select it out of the list of processes.
Crash Dump File
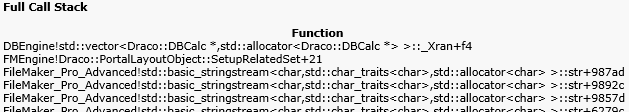
 After you have set up the rule, anytime that FileMaker crashes, a dump file will be created in the Userdump Path. Windows dump files cannot be viewed with a standard text editor, because it is a binary file. You will need to open the DebugDiag Analysis program and select “Crash/Hang Analyzers” and add the dump file as the data file. Now you can start the analysis, which will give a break down similar to the Mac crash report including the OS, the thread which caused the exception, and the stack trace. In the example provided below, FileMaker would continuously crash when running a script that printed numerous layouts in rapid succession. When we looked at the crash report, we were able to see that the FileMaker function calls referenced portals and related sets. This gave us the ability to narrow our search of a workaround by investigating the portals on these layouts for possible corruption.
Conclusion
The crash report provides valuable information, which can be used to help pinpoint exactly what in your FileMaker database is causing the FileMaker application to crash. Using the crash report allows you to narrow down the possible issues until a real solution is found.
Did you know we are an authorized reseller for Claris FileMaker Licensing?
Contact us to discuss upgrading your Claris FileMaker software.