
Zabbix, one of the largest free and open source server monitor applications with 300,000 installations worldwide, can be used to collect and display metrics from multiple FileMaker servers at once on one interface; therefore, giving you the ability to save time monitoring servers individually. Viewable from a web browser on a central dashboard, these metrics are displayed as charts, graphs, alerts, and reports with information fed in by the machines monitored by Zabbix. Furthermore, when issues are triggered by the monitored machines, notifications can be sent out. Let's take a look at how to set up Zabbix to monitor your FileMaker servers.
Initial Setup
Installation requires setting up a Zabbix server to monitor the various Zabbix agents (or clients). To monitor multiple FileMaker servers, Zabbix agents would be installed on each server machine, which would communicate with the central Zabbix server.
In the following walkthrough, we used an AWS Ubuntu web server for Zabbix server and a Windows FileMaker server for the Zabbix agent. Zabbix server can only be installed on Linux distributions.
The first step will be to identify the proper package from Zabbix’s website. This guide will be using Zabbix server version 4.2, Ubuntu 18.04, and MySQL due to our familiarity with each. Zabbix server requires a back end to store the data it collects from the Zabbix agents and a web front end to display the information.
Setting up Zabbix Server Back End
First we need to install the server back end and create the database to store our collected data. Download the Zabbix repository by running the following commands from your Zabbix server’s terminal.
~$ wget https://repo.zabbix.com/zabbix/4.2/ubuntu/pool/main/z/zabbix-release/zabbix-release_4.2-1+bionic_all.deb
~$ sudo dpkg -i zabbix-release_4.2-1+bionic_all.deb
~$ sudo apt update
Next, install Zabbix server with MySQL support.
~$ sudo apt install zabbix-server-mysql
Next, create a MySQL Zabbix database with a username of ‘zabbix.' The password is the variable <password> in this example.
Start the MySQL shell by running the mysql command.
~$ sudo mysql
Once in the MySQL shell, create the database and user with the variable <password> replaced with your chosen password enclosed in single quotes.
mysql> create database zabbix character set utf8 collate utf8_bin;
mysql> grant all privileges on zabbix.* to zabbix@localhost identified by '<password>';
mysql> quit;
Now import the schema for the newly created MySQL database. When prompted for the password, provide the password chosen in the previous step. This may take a while to complete.
~$ zcat /usr/share/doc/zabbix-server-mysql/create.sql.gz | mysql -uzabbix -p zabbix
Set up the config file with the database’s username and password by editing the zabbix_server.conf file located in /etc/zabbix/
~$ sudo vim /etc/zabbix/zabbix_server.conf
### Option: DBName
#       Database name.
#
# Mandatory: yes
# Default:
DBName=zabbix
### Option: DBUser
#       Database user.
#
# Mandatory: no
# Default:
DBUser=zabbix
### Option: DBPassword
#       Database password.
#       Comment this line if no password is used.
#
# Mandatory: no
# Default:
DBPassword=<password>
Setting up Zabbix Server Front End
Next up is installing the front end and creating the web pages to view the collected data.
~$ sudo apt install zabbix-frontend-php
Edit the apache.conf file located in /etc/zabbix/ to have the appropriate time zone by commenting out the line and entering your PHP timezone. Other PHP settings can also be modified here.
~$ sudo vim /etc/zabbix/apache.conf
php_value date.timezone America/Indianapolis
Restart Apache to apply changes.
~$ sudo systemctl restart apache2
Finally, start the Zabbix server process and enable it to start at system boot.
~$ sudo service zabbix-server start
~$ sudo update-rc.d zabbix-server enable
Zabbix server’s front end is accessed via a web browser. In order to be accessible and communicate with Zabbix agents, ports 80, 443, and 10050 need to be opened on the Zabbix server.
Copy all the files in the /usr/share/zabbix/ directory to a new Zabbix subdirectory in /var/www/html/zabbix.
First, create a new subdirectory and then copy the files.
~$ sudo mkdir /var/www/html/zabbix
~$ sudo cp -r /usr/share/zabbix/* /var/www/html/zabbix
In a browser, navigate to http://<server_ip_or_name>/zabbix. You should see the UI for the Zabbix front end. Check that the prerequisites are all OK, and enter the database information on the following screen. This is the information used when creating the MySQL database on the Zabbix server.
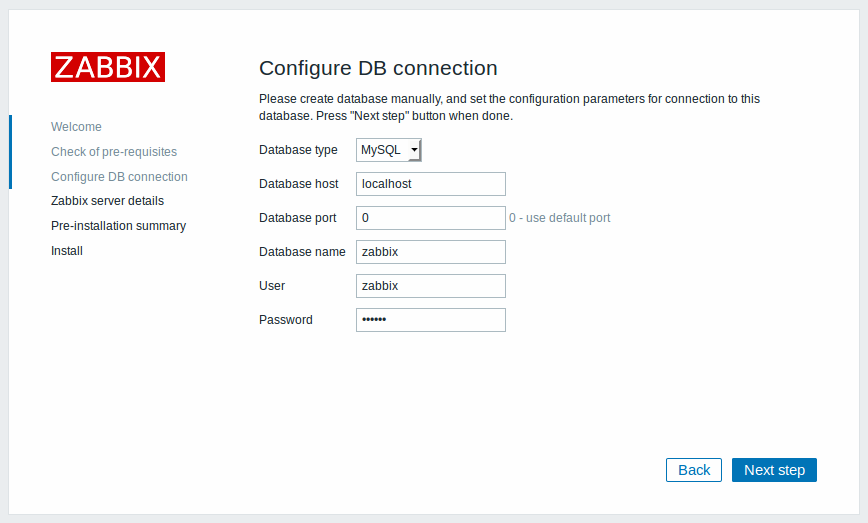
On the next screen, enter the Zabbix server details. The name field is what will be displayed on the menu bar and page titles. You will then get a summary of the information entered before finalizing your install. Once the setup is complete, log in using the default username and password ‘Admin’ and ‘zabbix.’
Setting up Zabbix Agent (Windows 10)
On Windows, Zabbix agent runs as a service and can either be downloaded as a zip archive or installed via the command prompt. In this example we’ll be using the zip archive.
After unzipping the files, choose or create a new directory to store the unzipped folders. For our purposes, we’re using:
C:\zabbix
Copy bin\zabbix_agentd.exe and conf\zabbix_agentd.win.conf files from the unzipped archive to your chosen directory. Our resulting directory is now
C:\zabbix
--bin
--conf
--zabbix_agentd.exe
--zabbix_agentd.win.conf
Next, we’ll need to edit the c:\zabbix\zabbix_agentd.win.conf file. For the ‘Server’ option, specify your Zabbix server’s fully qualified domain name. If you are enabling active checks, also specify the server name in the ‘SeverActive’ option. The ‘HostName’ option can be left blank.
### Option: Server
#   List of comma delimited IP addresses, optionally in CIDR notation, or DNS names of Zabbix servers and Zabbix proxies.
#   Incoming connections will be accepted only from the hosts listed here.
#   If IPv6 support is enabled then '127.0.0.1', '::127.0.0.1', '::ffff:127.0.0.1' are treated equally and '::/0' will allow any IPv4 or IPv6 address.
#   '0.0.0.0/0' can be used to allow any IPv4 address.
#   Example: Server=127.0.0.1,192.168.1.0/24,::1,2001:db8::/32,zabbix.domain
#
# Mandatory: yes, if StartAgents is not explicitly set to 0
# Default:
Server=<Zabbix server's FQDN>
### Option: ServerActive
#   List of comma delimited IP:port (or DNS name:port) pairs of Zabbix servers and Zabbix proxies for active checks.
#   If port is not specified, default port is used.
#   IPv6 addresses must be enclosed in square brackets if port for that host is specified.
#   If port is not specified, square brackets for IPv6 addresses are optional.
#   If this parameter is not specified, active checks are disabled.
#   Example: ServerActive=127.0.0.1:20051,zabbix.domain,[::1]:30051,::1,[12fc::1]
#
# Mandatory: no
# Default:
ServerActive=<Zabbix server's FQDN>
To install the Zabbix agent service, run the following command from the command prompt as an administrator. Again, in our example our files are placed in C:\zabbix.
C:\> C:\zabbix\zabbix_agentd.exe -c C:\zabbix\zabbix_agentd.win.conf -i
Now you will be able to manage the Zabbix agent service in the Windows services menu. To bring up the Windows services menu, navigate to
Control Panel\All Control Panel Items\Administrative Tools
and select ‘Services.’ It can also be opened by simply searching for ‘Services’ from the start menu. From here we can start, stop, and restart the Zabbix agent service as necessary.
Connecting Zabbix Agent to Zabbix Server
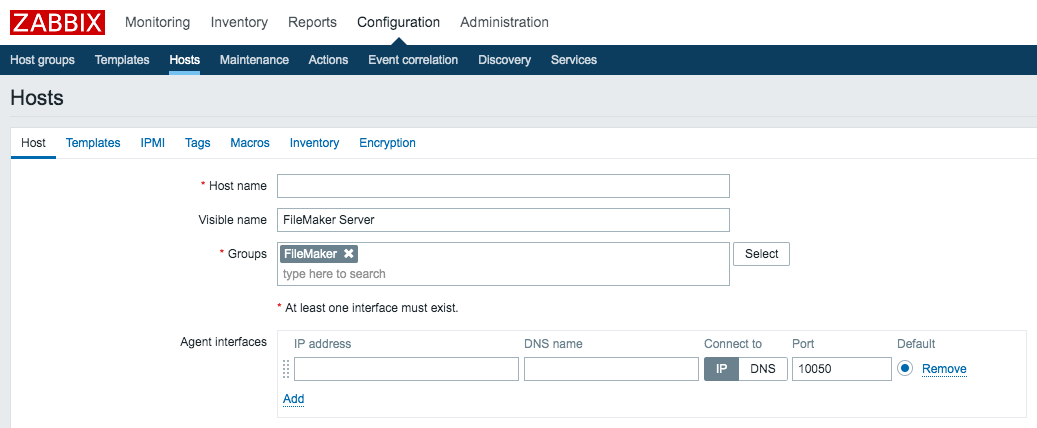
To connect Zabbix server to Zabbix agent, you will need to create a host and add a template.
On the Zabbix web dashboard, go to Configuration>Hosts>Create host. The Host name field will be the IP address or fully qualified domain name of the Zabbix agent that you want to add. The visible name is what is shown on the Zabbix dashboard. In the Groups field we can add a new group named FileMaker.
In the Agent interfaces section, again we will supply the IP address of the Zabbix agent and use port 10050. Once all the fields are populated, click Add at the bottom.
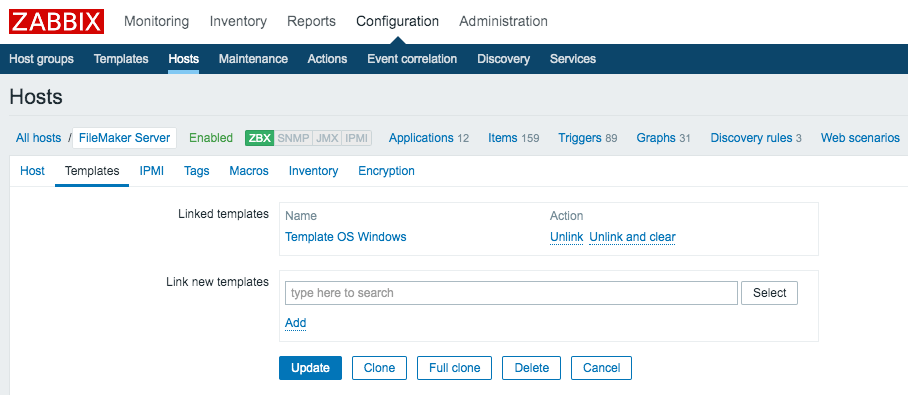
Now a template will need to be added to the host. Go to Configuration>Hosts and select the FileMaker Server host that was created. Select the Templates tab from here. A template can be specified in the 'Link new templates' section by searching for a template and then clicking 'Add'. After selecting the template, click update to save your changes. Zabbix provides many templates out of the box and they can all be customized for a user's needs.
To highlight a starting point, we'll add the "Template OS Windows" template, which includes basic hardware stat monitoring. Once the template is added, we can begin to see some of the data by going to the Monitoring->Graphs tab. From here, we can select the FileMaker Server host and the graph to display.
FileMaker Templates
In addition to the included templates, FileMaker has provided templates to monitor Windows, macOS, and Linux FileMaker Servers. These templates include items that monitor various FileMaker server ports, system processes, and triggers to send alerts if something goes wrong. To import custom templates, go to Configuration>Templates and click Import in the top right.
Conclusion
Once you have completed the installation process, Zabbix can be used to monitor multiple machines at once, while providing deeper customization to tailor its use to your needs. Contact us if you have any questions or need assistance setting up Zabbix monitoring.
Did you know we are an authorized reseller for Claris FileMaker Licensing?
Contact us to discuss upgrading your Claris FileMaker software.

