

 FileMaker offers many different options for charting, but if you need a chart that is not available in FileMaker, you should consider using Google Charts. Google Charts is a free Javascript framework that can be used in conjunction with web viewers in FileMaker to extend your charting capabilities. Since native FileMaker charting is much quicker and simpler to set up, let's look at some Google Charts.
Only Available in Google Charts
Geographic
Candlestick
Organizational
Treemap
Gauge
Timeline
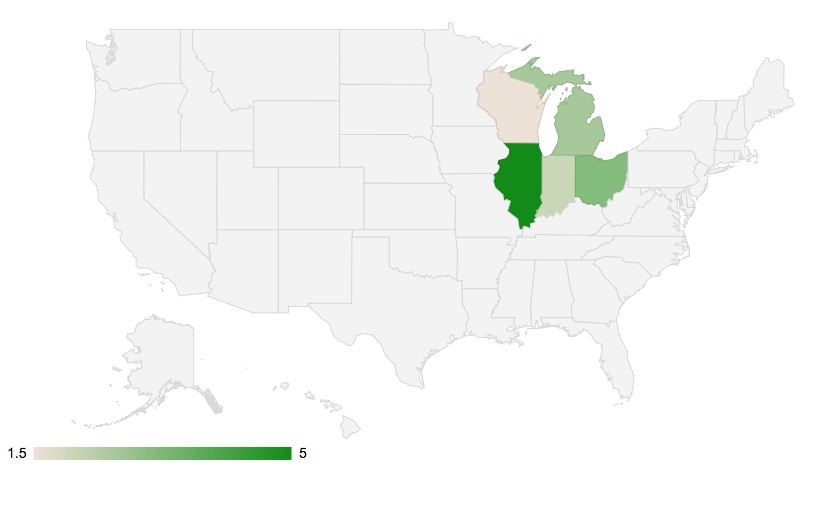
Geographic
This chart offers both a quick overview for an entire geographic region as well as discrete values per region. For example, if Finance needs a way to quickly view sales per state, the Geographic Chart can quickly show us that sales in Illinois are the highest. You can then hover over each state to see how much was sold in each.
When driving this chart with data from a FileMaker system, users can view a map rich with information at the click of a button.
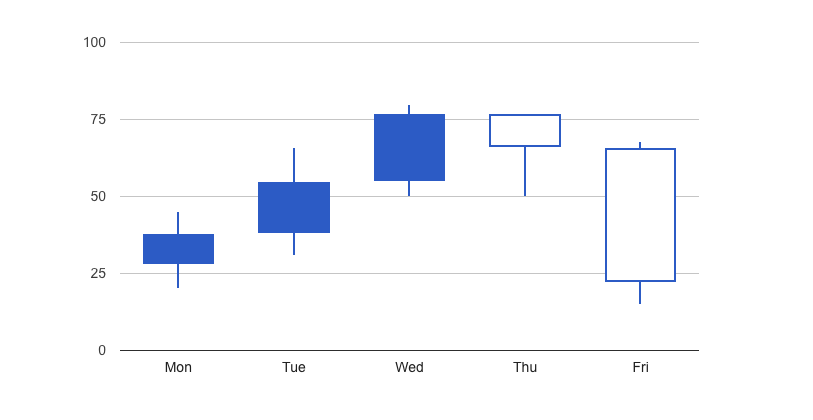
Candlestick
With the candlestick chart, you can quickly view a range of values along with its variance. It normally shows financial movements in price or cost. In this example, shaded boxes represent a gain and unshaded boxes represent a loss.
Source: https://developers.google.com/chart/interactive/do...
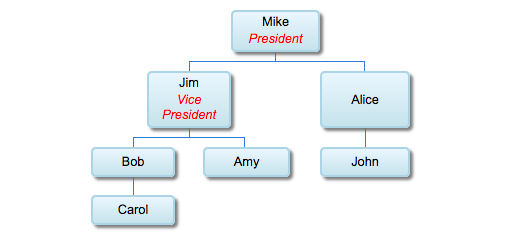
Organizational and Treemap
The next two charts help with viewing a tree data structure. First, the Organizational Chart shows a hierarchy of discrete data. Businesses often use this chart to show a literal hierarchy. This chart doesn’t have too many options, but a developer can configure options such as size, color, or clicking on a cell to collapse.
Source: https://developers.google.com/chart/interactive/do...
On a treemap, a user can only view one level at a time, but can navigate to each level. Though this graph also maps discrete values, developers can utilize this graph to show a visual summary of values associated with these discrete values. For example, this chart can show that sales in the USA are somewhere around twice as much as those in Mexico (see chart below).
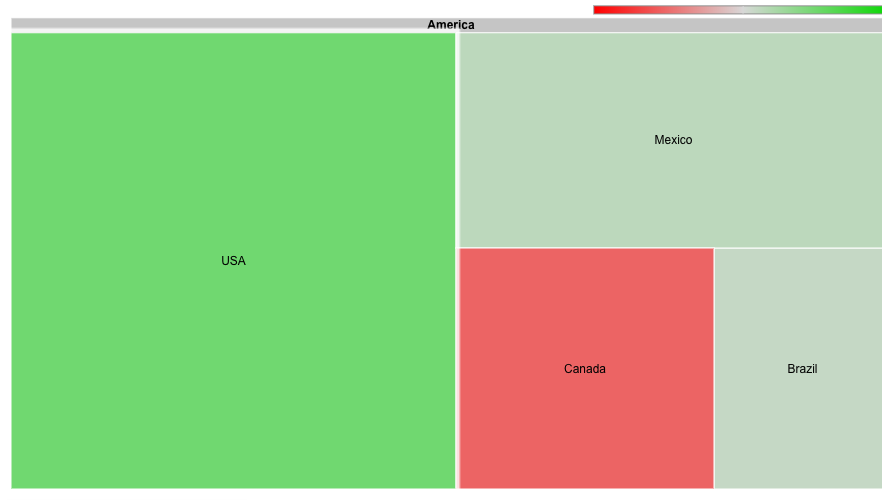
Source: https://developers.google.com/chart/interactive/do...
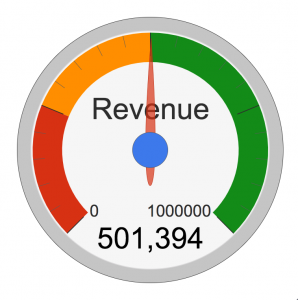
Gauge
Applications can utilize Google’s Gauge chart for a fun way to show “safe” and “dangerous” values. It offers the quick visuals of a 19th century railway gauge with all the customization one could desire! Developers can set coloring for ranges of values, specify minimum and maximum values, and even utilize animations to make the gauges more life-like. This chart could be used on an executive's dashboard to show actual revenue versus expected revenue.
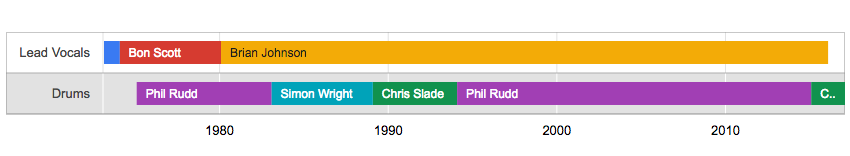
Timeline
The last Google Chart I’ll be covering is the Timeline chart. It helps view data associated with a range of time, reducing the amount of headache needed to process historical data. For example, some bands have an impossible amount of lineup changes, but using a Timeline can quickly clear up any confusion (unless you’re AC/DC and have over 10 former members).
Adding Google Charts to a FileMaker System
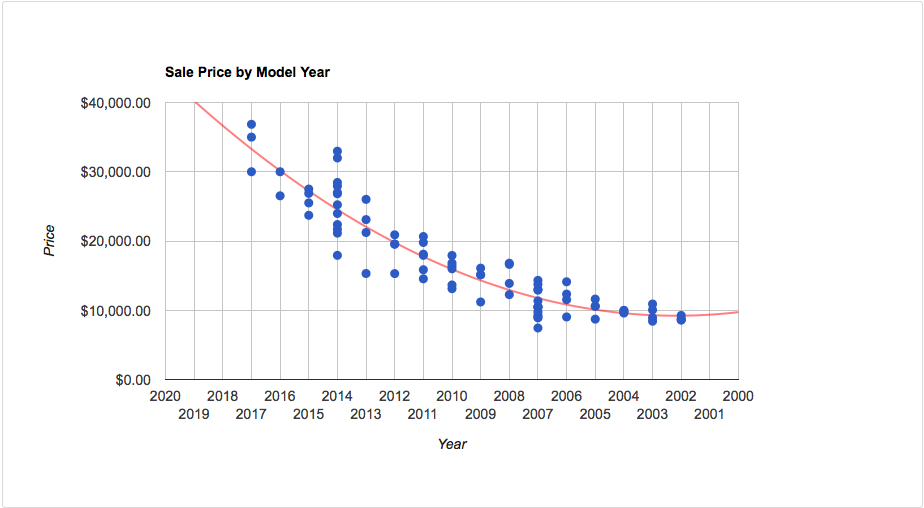
Google Charts also has some potentially useful options when it comes to simple graphs. Let's look at adding a trend line on a scatterplot graph using Google Charts in FileMaker.
Creating a Trend Line on a Scatterplot Chart
The Google Charts documentation offers a quick and easy way to start creating your own chart by providing code examples. The Google Charts framework has a couple of basic parts for each chart. The initial setup includes the following code:
<script type='text/javascript' src='https://www.gstatic.com/charts/loader.js'></script>
<script type='text/javascript'>
google.charts.load('current', {'packages': ['corechart']});
google.charts.setOnLoadCallback(drawChart);
Notice that the "google.charts.load" step includes packages; in this case the package "corechart", which is a scatterplot chart. This is the main differentiator between charts. Changing the package to "geochart" would completely change the graph type.
The next step is setting up the drawChart() function. This tells Javascript what data to draw and what options to use. All the data points are in the array variable "data".
function drawChart() {
    var data = google.visualization.arrayToDataTable([
        ['Year', 'Price'],
        [2010, 12000],
        [2017, 35000],
        ...
    ]);
    var options = {
        title: 'Sale Price by Model Year',
        hAxis: {
            title: 'Year', format: '', minValue: 2000, maxValue: 2018, direction:-1,
            minorGridlines: {color: '#333', count: 1}
        },
        legend: 'none',
        ...
    };
};
Lastly, Javascript needs to draw the chart. The following code assumes that there is a <div> with the ID "chart_div" in the HTML.
var chart = new google.visualization.ScatterChart(document.getElementById('chart_div'));
chart.draw(data, options);
Using this as a template, all your FileMaker application needs to do is compile data points and insert them into the "data" variable, making sure they are in the same array format. Nothing else in the chart needs to be data-driven, though you can let users edit any options they need to.
Using FileMaker to Plot Data
Of course, the big question is "How do I get my data from FileMaker onto a Google Chart?" As alluded to previously, we can use FileMaker scripting to insert data points into the Javascript in your web viewer. Please refer to the demo file for more details on how this process works.
Conclusion
Using Google Charts, you can extend FileMaker's charting capabilities with complex charts such as Timeline or Geographic charts. All it takes is a web viewer and a bit of Javascript know-how.
Javascript not your thing? Contact us to help put Google Charts in your FileMaker system.
Did you know we are an authorized reseller for Claris FileMaker Licensing?
Contact us to discuss upgrading your Claris FileMaker software.
Download the Google Charts in FileMaker File
Please complete the form below to download your FREE FileMaker file.